1.
The following bar graph shows the production of cement (in 10,000 tones) by 4 companies X, Y, Z and W during the period 2018 – 2020. Study the bar graph carefully and answer the question.
Which company has the maximum average production over the course of 3 years?

2.
The graph given below represents the number of students (in thousands), who opted for the given three subjects during the given four years.

Out of the total number of students who opted for the given three subjects in the year 2022, 42% were girls. How many boys chose the given three subjects?
3.
The given bar graph shows the production of onions (in quintals) from the year 2018 to 2022. Study the graph and answer the question that follows.

Considering the average production during this period, the number of years in which the production is above the average is:
4.
Study the given graph and answer the question that follows.
The graph shows the sales of three products: P, Q and R by four companies: A, B, C and D.
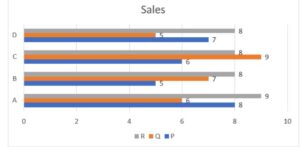
How much more in percentage is the total sales of R than sales of P (rounded off to one decimal place)?
5.
In a school, periodic examinations are held every two months. During the academic session from April 2001 to March 2002, a Class IX student appeared in each of these periodical exam. The line graph given below shows the total marks obtained by the student in each of the periodic exam.
Maximum total marks in each periodical exam = 500

What is the percentage of the marks obtained by the student when the periodical exam of August 2001 and October 2001 are combined?
6.
Examine the given pic chart regarding of steel by five states and answer the following question.

What is the central angle that corresponds to the production of steel by state D?
7.
The pic chart given here represents the domestic expenditure of a family in percent. Study the chart and answer the following question if the total monthly income of the family is ₹ 42,500.

After deduction for Child Education and deduction for house Rent, the total monthly income of the family remains:
8.
Refer to the given table and answer the question that follows.

How many cars were manufactured in October and November?
9.
The given table shows the number of the suitcases sold by different showrooms from 2018 to 2022.

The suitcases sold by the showroom D in 2019 is what percentage ( rounded off to two places of decimals) less than that sold by showroom B in 2021?
10.
Refer to the given table and answer the question that follows.

What was the revenue of the company if its expenditure was ₹600 crores in the year when its percentage profit was the maximum?
11.
The number of three different types of motor bikes B1, B2, and B3 manufactured by a company in three months is given in the following table. Study the given table carefully and answer the question that follows.

What is the average number of motor bikes manufactured by the company in the month of November?
12.
Study the table and find the value for R.
13.
Study the given table and answer the question that follows.
The given table shows the number of new employees added to different categories of employees in a company for four years and the number of categories of employees in a company for four years and the number of employees from these categories who left the company every year.

During the period between 2001 and 2004, the total number of Technicians who left the Company is what percentage (rounded off to the nearest integer) of the total number of Technicians who joined the Company?
14.
Examine the table and answer the question. Number of Candidates Appeared and Qualified in a Competitive Examination from Different States over the Years.

Total number of candidates qualified from all the states together in 1998 is approximately what percentage of the total number of candidates qualified from all the states together in 2000?
15.
The following table give the sales of batteries manufactured by a company over the years. Number of different types of batteries sold by a company over the years (numbers in thousand).

Which battery has the lowest total sales across all seven years ?

Leave a Reply